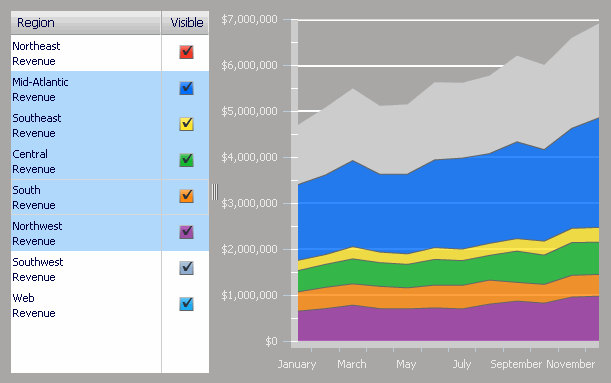
An Interactive Stacked Graph widget is a combination of a check box list and an area graph. The graph displays the contribution of various metric series to the change in value of a larger set of data. This widget allows you to visualize total metric values as one large stacked area, and the individual pieces of that total as smaller stacked areas within the large stacked area.

To analyze data in an Interactive Stacked Graph widget:
To change the data that is displayed in the area graph on the right, select individual attribute elements (for example, a list of years) using the check boxes on the left. When all check boxes are selected, the area graph is at its maximum size.
To analyze how the individual parts make up the whole, for example when making percent-to-total comparisons, click the name of the attribute element on the left. The portion of the area graph representing the attribute element is highlighted. Select multiple items by pressing CTRL and selecting elements.
If the document contains a grid/graph report or panel stack that is connected to this widget, click the check boxes or area graph to display related data in connected grid/graph reports and panel stacks.
Not all features described above may be enabled in all documents.
Related topics