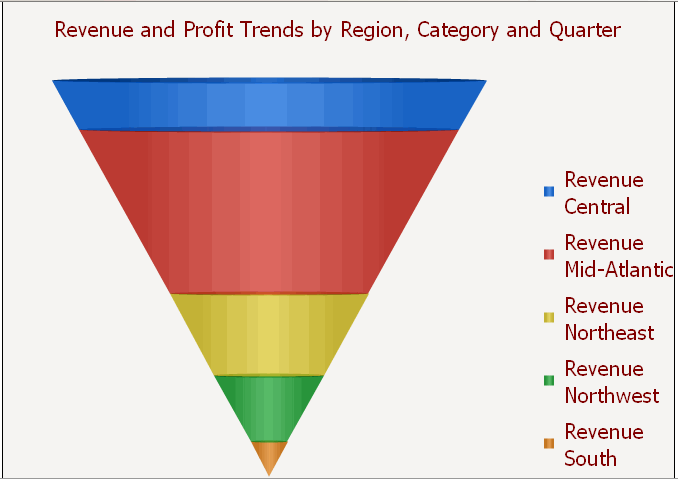
The Funnel widget can be used for a wide variety of business purposes, including application management, click management, pipeline analyses for sales forecasts, and sales process analysis. The widget is a variation of a stacked percent bar chart that displays data that adds up to 100%.

Therefore, it can allow analysts to visualize the percent contribution of sales data or the stages in a sales process and reveal the amount of potential revenue for each stage. When the widget is used to analyze a sales process, analysts can use the widget to drill down to key metrics such as deal size, profit potential, and probability of closing. The widget can also be used to identify potential problem areas in an organization’s sales processes.
Related topics