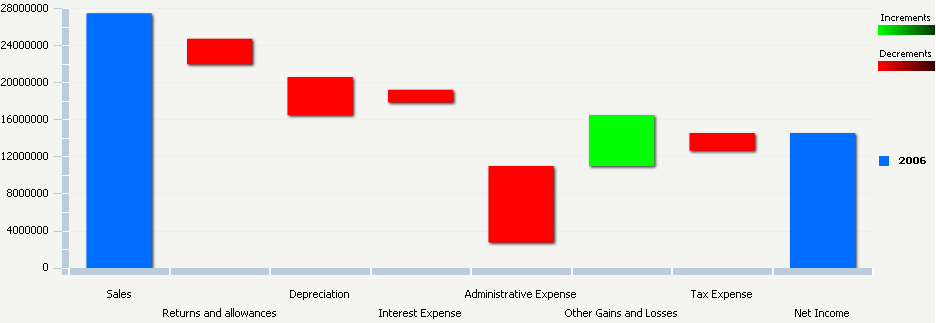
A Waterfall widget highlights the increments and decrements of metrics over time and also gives information about the factors that contribute to the values of those metrics. The increments and decrements in the widget are calculated and displayed according to the specific metrics included on the Grid/Graph and the order of the metrics.

Related topics