You can create an indented grouping of related data on a grid report by organizing the data into a standard outline style. An outline lets you collapse and expand sections of related data.
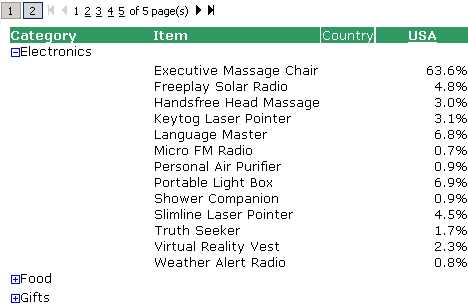
For example, in the report below, you can expand and collapse data for product categories, such as electronics, food, and gifts.

When Outline mode is enabled on a report, you expand and collapse data using the plus and minus icons on the left or the numbered buttons above the report, as shown in the image above.
Outline mode works the same for Grid/Graphs on a document as it does for reports.
When you export a report that has Outline mode enabled, the report's outline look and feel is maintained in Excel. This means that if you have the first two attributes expanded and the last one collapsed in the report before you export, the same attributes are expanded and collapsed in Excel. You can use the expand and collapse buttons in Excel to change the data that is displayed.
Outline mode is only available when the report has more than one object in the rows.
Outline mode is available only if DHTML is enabled. See DHTML-only features in Web.
Click the name of a grid report to execute it.
From the Tools menu, select Report Options. The Report Options dialog box opens.
Select the Outline check box, and click OK.
Expand and collapse individual levels
by clicking the  or
or  icons within each row on the report. Click the numbered
buttons above the report to expand or collapse data for the page displayed.
Multiple-page reports work in the same way. For example, if you are
on page 4 of a multiple-page report and you want to collapse the data
to the second level, then you will only be collapsing data that is displayed
on the fourth page of the report.
Related topic
Understanding how data is displayed: Incremental Fetch