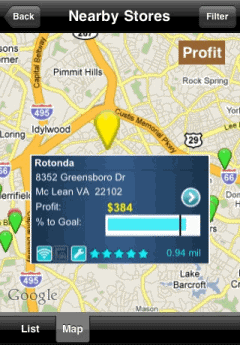
The Map widget allows users to search and view information based on locations on a map. Locations on the map are displayed using map markers when the widget is displayed on an iPhone or iPad with MicroStrategy Mobile. Selecting a map marker displays an Information Window with additional details about the selected location.
For example, in the image below, stores are displayed as markers in the Map widget. When a user selects a marker, an Information Window for the store is displayed, with the store's name, address, and distance from the current location of the user.
You can use static images as map markers in the widget, or display the map markers as dynamic bubbles. The size of each dynamic bubble is automatically determined based on the value of the metric on the columns of the widget, with the largest bubbles being displayed for the largest metric values.
You can allow users to select a map marker on the iPhone or iPad to open a link to a report or document. To do so, add the link to the report or document to the location attribute on the Map widget's Grid/Graph. For steps, see Linking in documents.
You can format a Map widget to:
Define a custom Information Window to display in the widget, instead of displaying the default Information Window. For steps and example images of custom and default Information Windows, see Defining an Information Window in a Map widget.
Enable a list of locations in the widget (called a List layout), and use it to display information for each location in the list. For steps, see Creating a list of locations for a Map widget.
Display lines representing relationships between locations in the widget, such as flight connections between airports or delivery connections between shipping centers. For steps, see Using lines to display relationships between locations in a Map widget.
The following table describes how Map widgets can be displayed in different MicroStrategy Web modes. For steps to change the display of widgets, see Determining how a widget is rendered in non-Flash modes.
|
Mode |
Display Options |
|
Design Mode |
|
|
Editable Mode, Flash Mode |
|
|
Express Mode, Interactive Mode, or when exported to PDF or Excel |
|
|
iPhone and iPad |
|
You can also define a threshold on a metric in the widget, to do the following:
The color of dynamic bubbles in the widget can change automatically, based on the value of a metric. For example, you can have the widget display green dynamic bubbles for locations with profit data greater than $1,000,000. To do this, you must define a threshold on the metric to change the font color in which metric values are displayed, then enable threshold formatting to be displayed in the widget. When the widget is displayed on the iPhone or iPad, the threshold color is used to override the default color of the dynamic bubbles for locations that meet the threshold condition.
The image markers can be replaced automatically with different images based on the value of a metric. For example, you have the widget display an image of a red flag for stores with revenue data less than $500,000. To do this, you must define a threshold on the metric to replace metric values with an image for locations that meet the threshold condition. When the widget is displayed on the iPhone or iPad, the image is used to replace the map markers. The images should be 50 x 60 pixels, with 72 dpi.
For steps to apply threshold formatting to a Map widget, see Formatting a Map widget for the iPhone or iPad. For an introduction to thresholds, with examples and images, see the Basic Reporting Guide.
You can filter the locations displayed on a map to view only those locations that meet certain criteria. For example, if store locations are displayed on a map, you can use a Geo Location prompt to use the current location of the iPhone or iPad, to display only those stores within the current city, state, or zip code.
You can also create a filter or prompt to display data only for locations within a specific distance from the current location of the iPhone or iPad. For steps, see Filtering data based on geographical distance from an iPhone or iPad.
The following procedures provide separate steps to display a report as a Map widget, or add a Map widget to a document.
This procedure assumes you have already created at least one attribute that provides the geographical location of each item displayed in the Map widget. The attribute must provide this information in one of the following ways:
Using attributes: You must provide an attribute that contains the location of each element as a geographical point, or two attributes, one containing the latitude of each element, and one containing the longitude.
Using attribute forms within an attribute: You must provide the location of each element as a geographical point in the attribute form of a single attribute, or provide an attribute with two attribute forms, with separate values for the latitude and longitude of each element.
Note: For more information on the requirements for the location information, see the MicroStrategy Project Design Guide.
Open the document in Design or Editable Mode.
From the Insert menu, point to Widgets, then iPhone/iPad. Select Map.
Click the location on your document where you want to place the widget's Grid/Graph. When the widget is displayed on an iPhone or iPad, this Grid/Graph will not be visible to the user. If desired, resize the Grid/Graph by clicking and dragging its handles.
From the Dataset Objects panel on the left, select attributes and metrics, and drag them on top of the widget, as described below.
Place at least one attribute on the Grid/Graph's rows. The elements of this attribute are displayed as items on the map. You must provide the geographical location of each item in one of the following ways:
Using attributes: You must provide an attribute that contains the location of each element as a geographical point, or two attributes, one containing the latitude of each element, and one containing the longitude.
Using attribute forms within an attribute: You must provide the location of each element as a geographical point in the attribute form of a single attribute, or provide an attribute with two attribute forms, with separate values for the latitude and longitude of each element.
Note: For more information on the requirements for the location information, see the Warehouse Structure for Your Logical Data Model chapter in the MicroStrategy Project Design Guide.
Place at least one metric on the Grid/Graph's columns.
Configure the widget's display properties
Right-click the widget, then select Properties and Formatting. The Properties and Formatting dialog box opens.
From the left, select Widget.
Click the Widget
Properties icon  . The Map Properties dialog box opens.
You can choose to provide the location information of each map marker using attributes, or attribute forms within a single attribute. Do one of the following:
To provide the location information using attribute forms, from the Use Attribute or Form drop-down list, select Use Attribute Form. From the Select Attribute drop-down list, select the attribute that contains the location information.
To provide the location information using attributes, from the Use Attribute or Form drop-down list, select Use Attribute.
You can choose to provide the location information as a separate latitude and longitude, or a geographical point. Do one of the following:
To define the location as a latitude and longitude, from the Select Data Type drop-down list, select Latitude/Longitude. Perform the following steps:
From the Select Latitude drop-down list, select the attribute or attribute form that contains the latitude information.
From the Select Longitude drop-down list, select the attribute or attribute form that contains the longitude information.
To define the location as a point, from the Select Data Type drop-down list, select Point. From the Select Point drop-down list, select the attribute or attribute form that contains the point information.
By default, if multiple locations in the widget have the same latitude and longitude, a separate map marker is displayed for each location. For example, several different stores are located in the same building. You can choose to display a separate map marker for each store, or display a single map marker for all of the stores in the building. This option is only available if the Use Attribute or Form option is set to Use Attribute. Do one of the following:
To display a single map marker, select the For repeated rows, display only one marker for same location check box. When the user taps the map marker on the iPhone or iPad, information for each location at the selected latitude and longitude is displayed. If map markers in the widget are displayed as dynamic bubbles and a group of locations is located at the same latitude and longitude, the bubble marker for this group is sized and colored based on the last location in the group, as displayed in the widget’s Grid/Graph. If subtotals are displayed in the widget’s Grid/Graph, the subtotal for the group is used to size and color the bubble marker.
To display a map marker for each location, clear the For repeated rows, display only one marker for same location check box.
You can use static images as map markers for locations displayed in the Map widget, or display the map markers as dynamic bubbles. The size of each dynamic bubble is automatically based on the value of the metric on the columns of the widget's Grid/Graph. Do one of the following:
To use images to mark locations on the map, select the Use Image Markers option, then select a display style from the drop-down list. A preview of the currently selected marker style is displayed to the right of the drop-down list. The options include:
Balloon Push Pin 
Regular Push Pin 
Rounded Push Pin 
To use dynamic bubbles to mark locations on the map, select the Use Dynamic Bubbles option. To specify a maximum bubble size, type a number in the Maximum bubble size field. The default is 100.
From the Default View drop-down list, select one of the following.
To display the widget as a map, select Map.
To display the widget as a satellite image, select Satellite.
To display the widget as a satellite image, with boundaries and place names displayed over the image, select Hybrid.
You can define a threshold on a metric
in the Map widget, then choose to enable the display of thresholds in
the widget, to change the color of dynamic bubbles or replace a map marker
with a static image based on the value of a metric.
To change the color of dynamic bubbles, you must define a threshold
that formats the font color in which metric values are displayed. To replace
map marker images, you must define a threshold that replaces metric values
with an image. The image should be 50 x 60 pixels, with 72 dpi.
Sample images are located by default in Program Files\MicroStrategy\Intelligence
Server\images\quickThresholdImgs. For detailed steps to define
a threshold, see
Creating
a conditional format using complex conditions.
Do one of the following:
To enable threshold display, select the Apply threshold for the map check box.
To disable threshold display, clear the Apply threshold for the map check box.
By default, selecting a map marker
displays additional information about the location in an Information Window.
You can define a layout in the document to use as a custom Information
Window, and format its appearance. To select an existing document layout
as a custom Information Window, perform the following steps:
Note: To define a custom Information Window, you must first
enable the layout to be used as an Information Window. For detailed steps
to define and format an Information Window, see
Defining
an Information Window in a Map widget.
Select the Display Information Window from document layout check box.
From the Select Layout to use drop-down list, select the name of the layout to use as the Information Window.
Click OK to return to the Properties and Formatting dialog box.
Click OK again to save your changes.
The Custom Visualizations Editor must be enabled. For more information on the Custom Visualizations Editor, see the Web Administrator Help.
This procedure assumes you have already created a report with the following requirements:
At least one attribute on the grid's rows, which you must create to provide the geographical location of each item displayed in the Map widget. You must provide this information in one of the following ways:
Using attributes: You must provide an attribute that contains the location of each element as a geographical point, or two attributes, one containing the latitude of each element, and one containing the longitude.
Using attribute forms within an attribute:
You must provide the location of each element as a geographical point
in the attribute form of a single attribute, or provide an attribute with
two attribute forms, with separate values for the latitude and longitude
of each element.
Note: For more information on the requirements for the
location information, see the MicroStrategy
Project Design Guide.
One metric on the grid's columns.
Click the name of the report to run it.
From the Tools menu, select Custom Visualizations. The Custom Visualizations dialog box opens.
Do one or both of the following:
To display the report as a Map widget on the iPhone, from the iPhone drop-down list, select Map.
To display the report as a Map widget on the iPad, from the iPad drop-down list, select Map.
Click the Widget
Properties icon . The Map Properties dialog box opens.
You can choose to provide the location information of each map marker using attributes, or attribute forms within a single attribute. Do one of the following:
To provide the location information using attribute forms, from the Use Attribute or Form drop-down list, select Use Attribute Form. From the Select Attribute drop-down list, select the attribute that contains the location information.
To provide the location information using attributes, from the Use Attribute or Form drop-down list, select Use Attribute.
You can choose to provide the location information as a separate latitude and longitude, or a geographical point. Do one of the following:
To define the location as a latitude and longitude, from the Select Data Type drop-down list, select Latitude/Longitude. Perform the following steps:
From the Select Latitude drop-down list, select the attribute or attribute form that contains the latitude information.
From the Select Longitude drop-down list, select the attribute or attribute form that contains the longitude information.
To define the location as a point, from the Select Data Type drop-down list, select Point. From the Select Point drop-down list, select the attribute or attribute form that contains the point information.
By default, if multiple locations in the widget have the same latitude and longitude, a separate map marker is displayed for each location. For example, several different stores are located in the same building. You can choose to display a separate map marker for each store, or display a single map marker for all of the stores in the building. This option is only available if the Use Attribute or Form option is set to Use Attribute. Do one of the following:
To display a single map marker, select the For repeated rows, display only one marker for same location check box. When the user taps the map marker on the iPhone or iPad, information for each location at the selected latitude and longitude is displayed. If map markers in the widget are displayed as dynamic bubbles and a group of locations are located at the same latitude and longitude, the bubble marker for this group is sized and colored based on the last location in the group, as displayed in the widget’s Grid/Graph. If subtotals are displayed in the widget’s Grid/Graph, the subtotal for the group is used to size and color the bubble marker.
To display a map marker for each location, clear the For repeated rows, display only one marker for same location check box.
You can use static images as map markers for locations displayed in the Map widget, or display the map markers as dynamic bubbles. The size of each dynamic bubble is automatically determined based on the value of the metric on the columns of the widget's Grid/Graph. Do one of the following:
To use images to mark locations on the map, select the Use Image Markers option, then select a display style from the drop-down list. A preview of the currently selected marker style is displayed to the right of the drop-down list. The options include:
Balloon Push Pin
Regular Push Pin
Rounded Push Pin
To use dynamic bubbles to mark locations on the map, select the Use Dynamic Bubbles option.
From the Default View drop-down list, select one of the following.
To display the widget as a map, select Map.
To display the widget as a satellite image, select Satellite.
To display the widget as a satellite image, with boundaries and place names displayed over the image, select Hybrid.
You can define a threshold on a metric
in the Map widget, then choose to enable the display of thresholds in
the widget, to change the color of dynamic bubbles or replace a map marker
with a static image based on the value of a metric.
To change the color of dynamic bubbles, you must define a threshold
that formats the font color in which metric values are displayed. To replace
map marker images, you must define a threshold that replaces metric values
with an image. The image should be 50 x 60 pixels, with 72 DPI. Sample
images are located by default in Program Files\MicroStrategy\Intelligence
Server\images\quickThresholdImgs. For detailed steps to define
a threshold, see the Basic Reporting
Guide.
Do one of the following:
To enable threshold display, select the Apply threshold for the map check box.
To disable threshold display, clear the Apply threshold for the map check box.
Click OK to return to the Custom Visualizations dialog box.
Click OK again to save your changes.
Related topics